📊 Analytics
The admin dashboard provides real-time statistics and date-range analytics for restaurant operations.
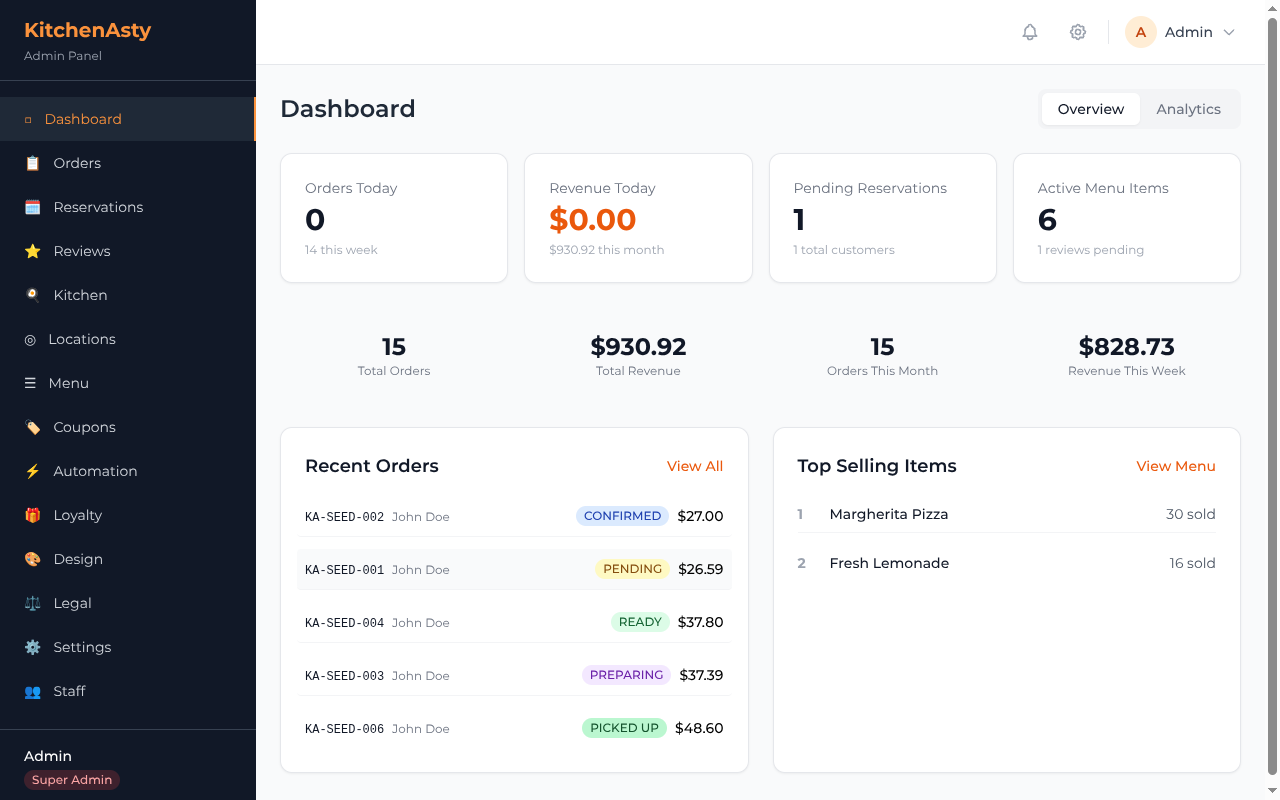
📈 Dashboard Stats
The stats endpoint returns current overview numbers:
GET /api/dashboard/stats
Authorization: Bearer <staff-token>
Returns:
| Metric | Description |
|---|---|
| 📦 Total orders | All-time order count |
| 💰 Total revenue | Sum of completed order totals |
| 👥 Total customers | Registered customer count |
| ⏳ Pending orders | Orders awaiting confirmation |
| 📅 Today's orders | Orders placed today |
| 💵 Today's revenue | Revenue from today's orders |
📉 Analytics
The analytics endpoint returns time-series data for charts:
GET /api/dashboard/analytics?startDate=2025-01-01&endDate=2025-01-31
Authorization: Bearer <staff-token>
Query parameters:
| Parameter | Description |
|---|---|
startDate | 📅 Start of date range (ISO date) |
endDate | 📅 End of date range (ISO date) |
Returns daily aggregated data including orders, revenue, and new customers.
📊 Admin Dashboard Charts
The admin frontend uses Recharts to render:
- 📈 Revenue over time (line chart)
- 📊 Orders over time (bar chart)
- 🥧 Order status distribution (pie chart)
🔐 Access
Analytics endpoints require staff authentication. All staff roles (STAFF, MANAGER, SUPER_ADMIN) can view dashboard stats and analytics.
📡 API
See Dashboard API for the complete endpoint reference.